( This post is related to my GSoC project with Marble. For more information you can read the introductory post )
As I mentioned in my earlier post, I modified the polyshp2osm tool so as to support conversion of Natural Earth shapefiles to OSM format so that Marble is able to render geographical features(roads, rivers, reefs, airports) provided by the Natural Earth data set. Now the primary problem was that Marble never supported the rendering of many of the geographical features provided by Natural Earth. In order to enable rendering of a new geographic feature(reef, boundaries), one needs to describe how the feature must be styled by describing the colors to be used, the width of the boundaries, any geometric patterns or any icon which needs to be associated with the geometry.
Before describing my work let me first describe how Marble handles the styling for the vector OSM theme. Marble reads the OSM file and for any geographical feature (roads, rivers, reefs, airports, shops, buildings etc) assigns it a GeoDataVisualCategory value. The geometry associated (point, polygon, linestring ) with the geographical feature is primarily styled according to this GeoDataVisualCategory. Depending on the presence of other OSM key=value pair tags and the current zoom level of the map, Marble might dynamically change the styling.
In fact, this ability to dynamically change the styling was recently added by my mentor Dennis Nienhüser during the Randa meetings.
In most of the cases, for adding the styling for a new geographic feature in Marble, one needs to do the following steps
- Create a new GeoDataVisualCategory
- Assign a default style to this GeoDataVisualCategory by describing the colors, width, pattern, icon which are associated with the feature
- Decide the order of this new visual category w.r.t other visual categories. Visual categories which have a higher priority will be drawn on top of visual categories which have a lower priority.
- Decide the minimum zoom level at which this new visual category starts appearing.
- Map this visual category to some corresponding OSM key-value pair.
- Decide if you want to change the default styling associated with this GeoDataVisualCategory on some particular zoom level or when some particular OSM key=value tags are encountered.
Natural Reefs
Has an OSM equivalent natural=reef which I used for tag mapping it to the styling of reefs.
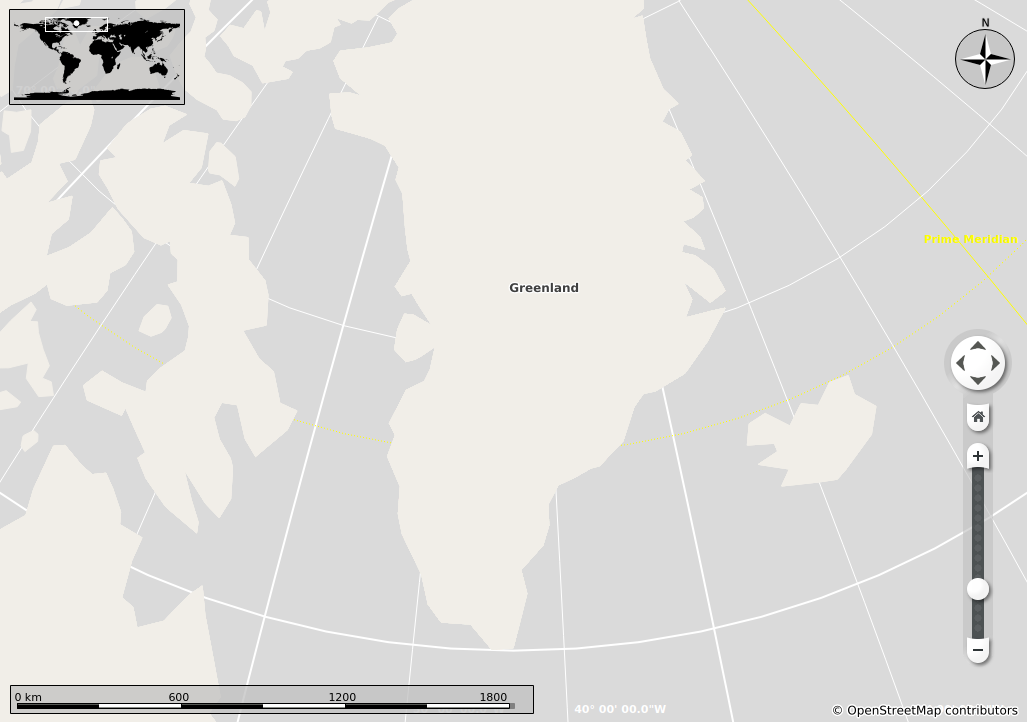
Landmass
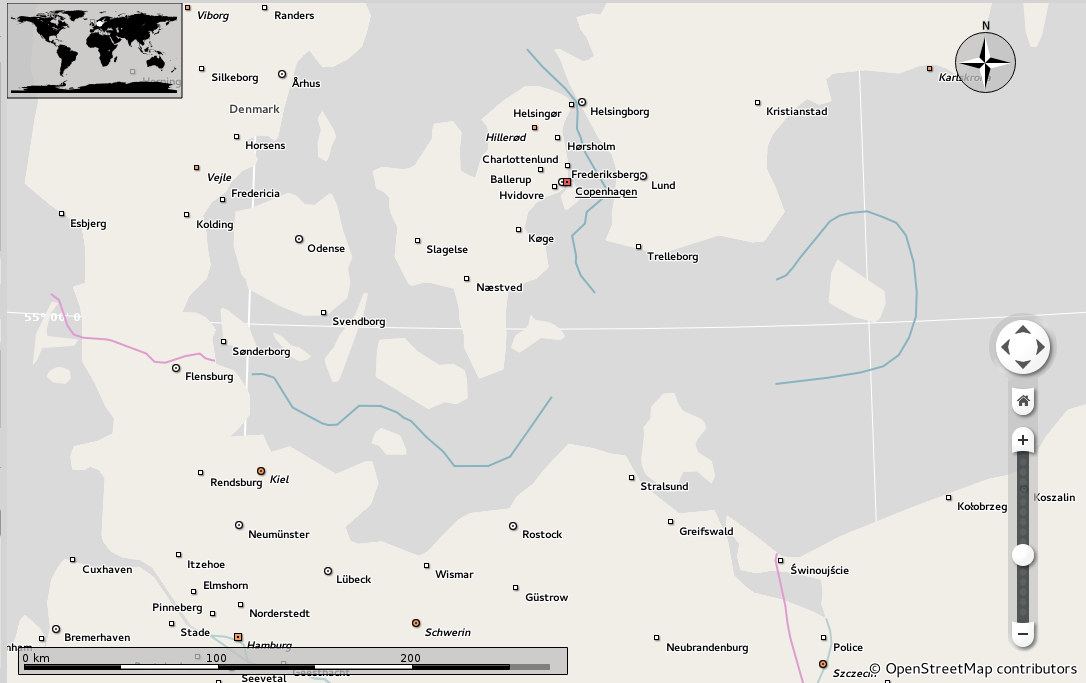
Natural Earth provides the data for countries, continents, urban areas, islands as polygons. In order to provide a common tag mapping for these land polygons, I constructed a custom marble_land=landmass for tag mapping the above land polygons to the styling of rendered land areas in Marble.
Administrative Boundaries
The OSM administrative boundaries have an admin_level=x tag which defines the size/importance of a particular administrative boundary. I tag mapped these admin_level=(1..11) tags to 11 different GeoDataVisualCategories .
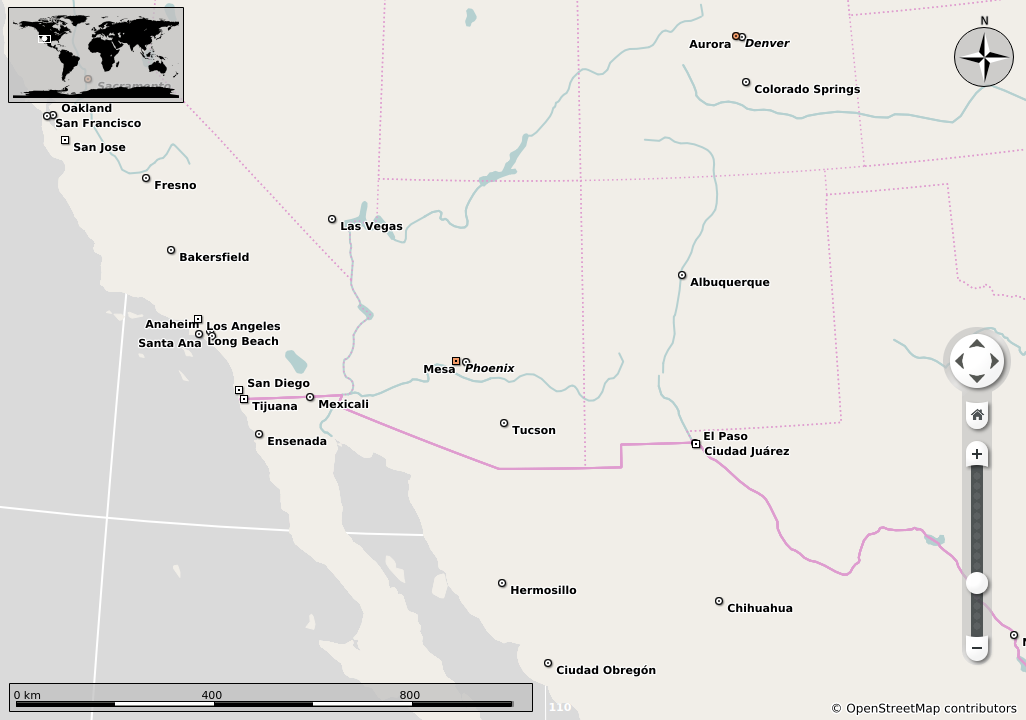
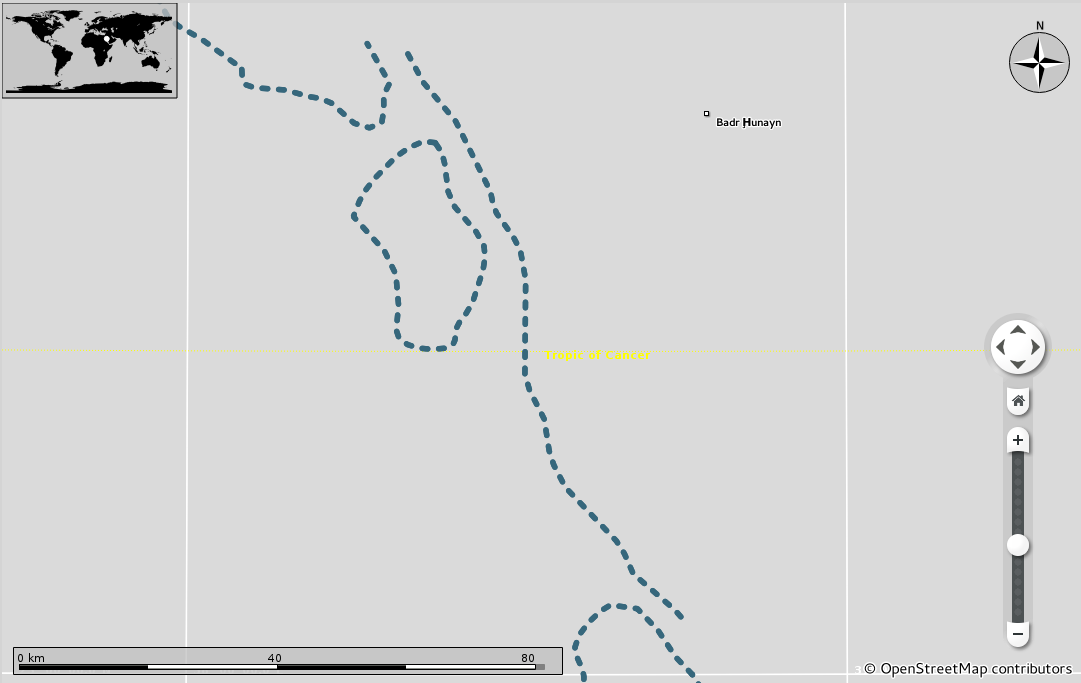
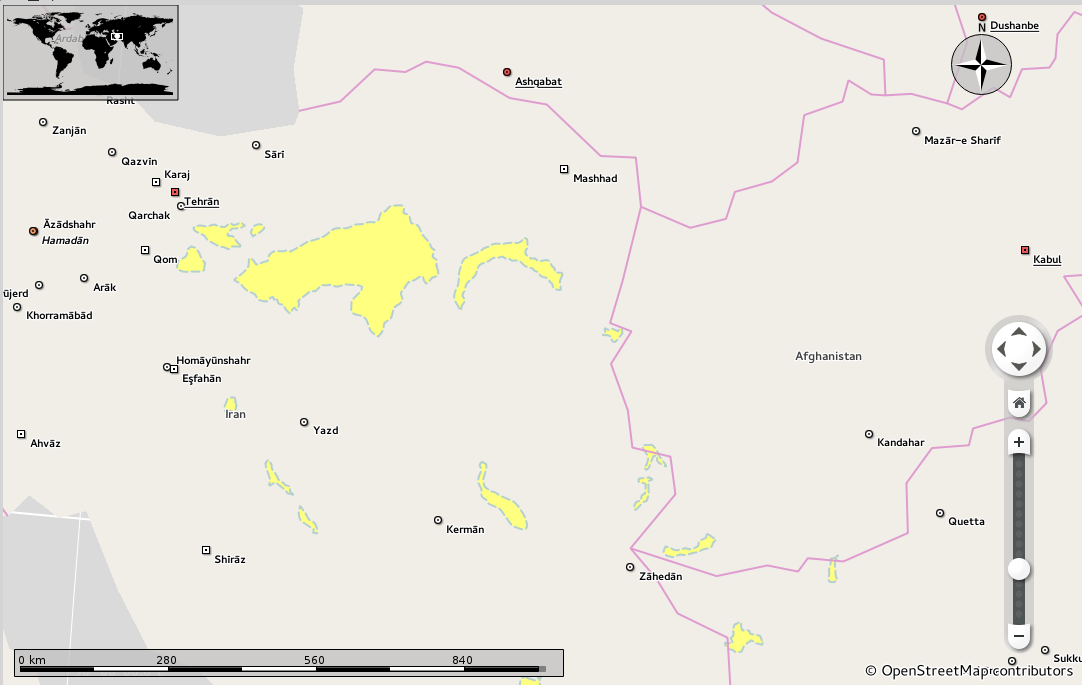
Salt Lakes
Instead of creating a new visual category, I added an additional OSM tag salt=yes to the list of key=value tags list of salt lakes while keeping the visual category as NaturalWater. Now when a salt lake in encountered during parsing, Marble assigns it the default styling of NaturalWater which is a shade of blue with blue outline. However due to the tag salt=yes the styling changes to a shade of yellow with a dashed blue line.
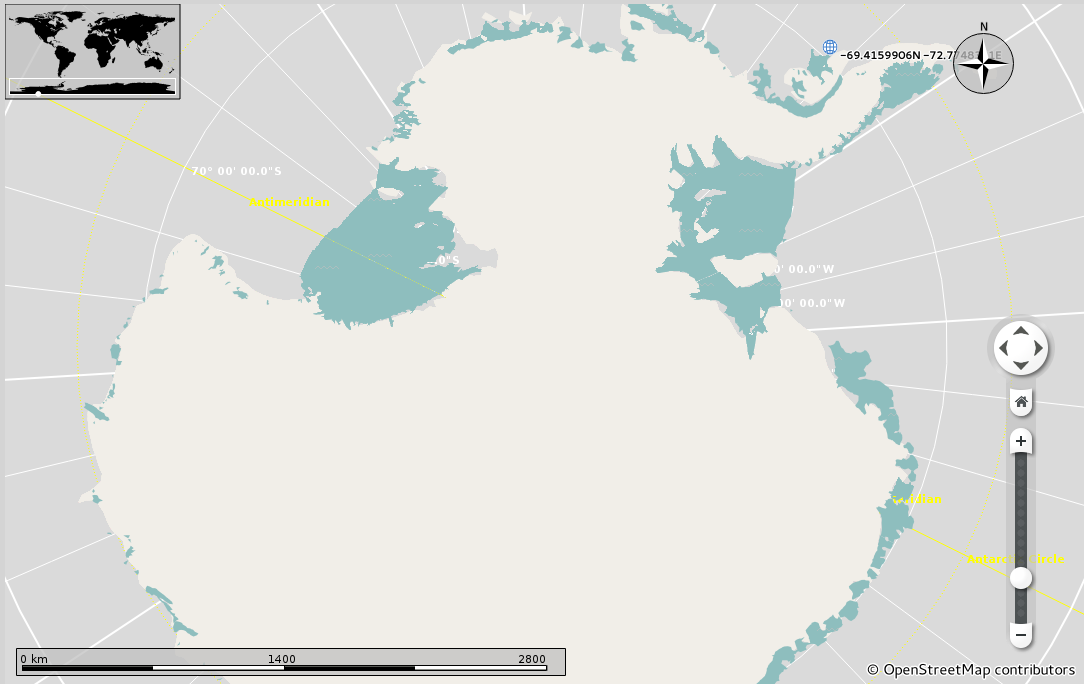
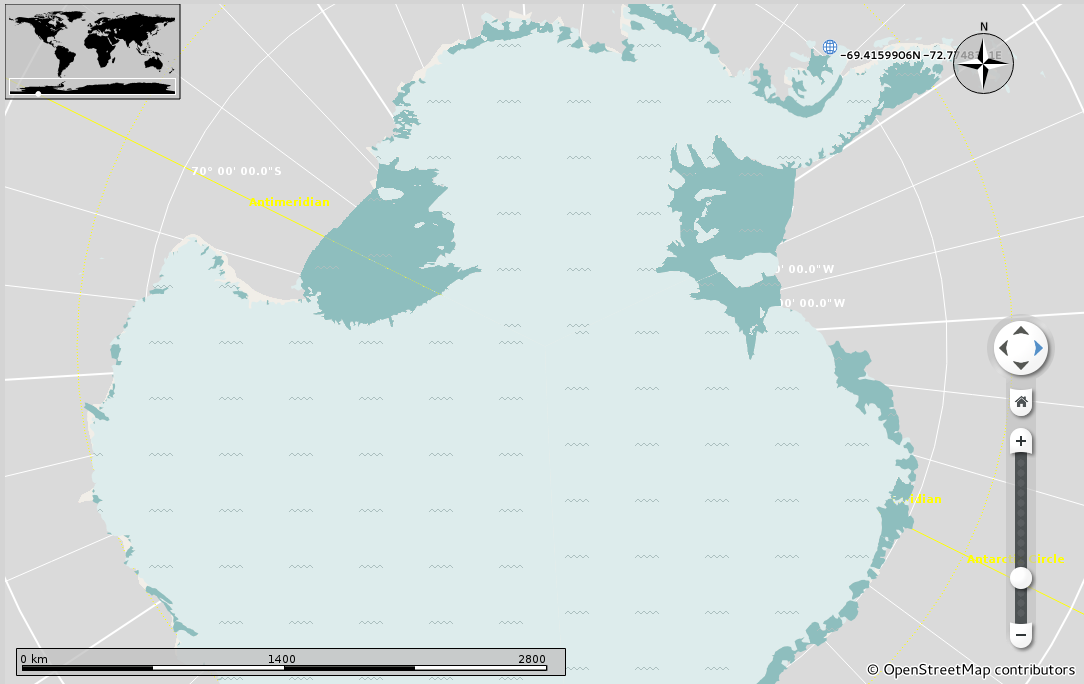
Antarctic Ice Shelves
I created a new visual category NaturalIceShelf for styling the antarctic ice shelves and tag mapped it to natural=glacier and glacier:type=shelf
Marine Indicators
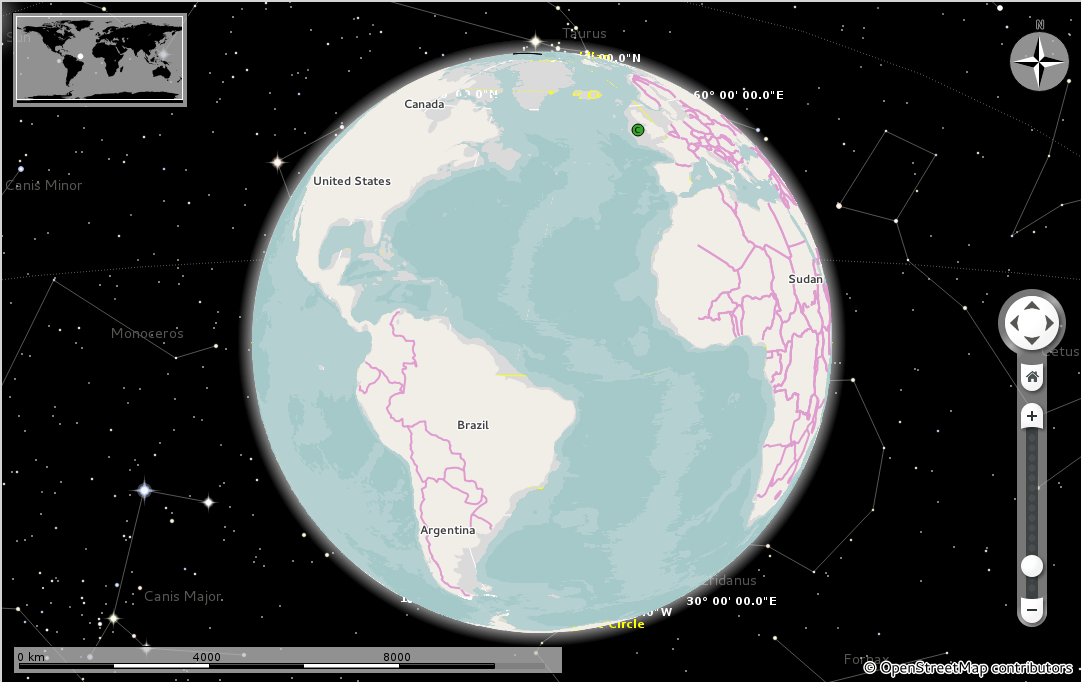
I tag mapped the OSM tag maritime=yes to a new visual category BoundaryMaritime whereas used the tags (boundary=administrative, admin_level=2, maritime=yes, border_type=territorial) for dynamically changing the styling of disputed marine boundaries.
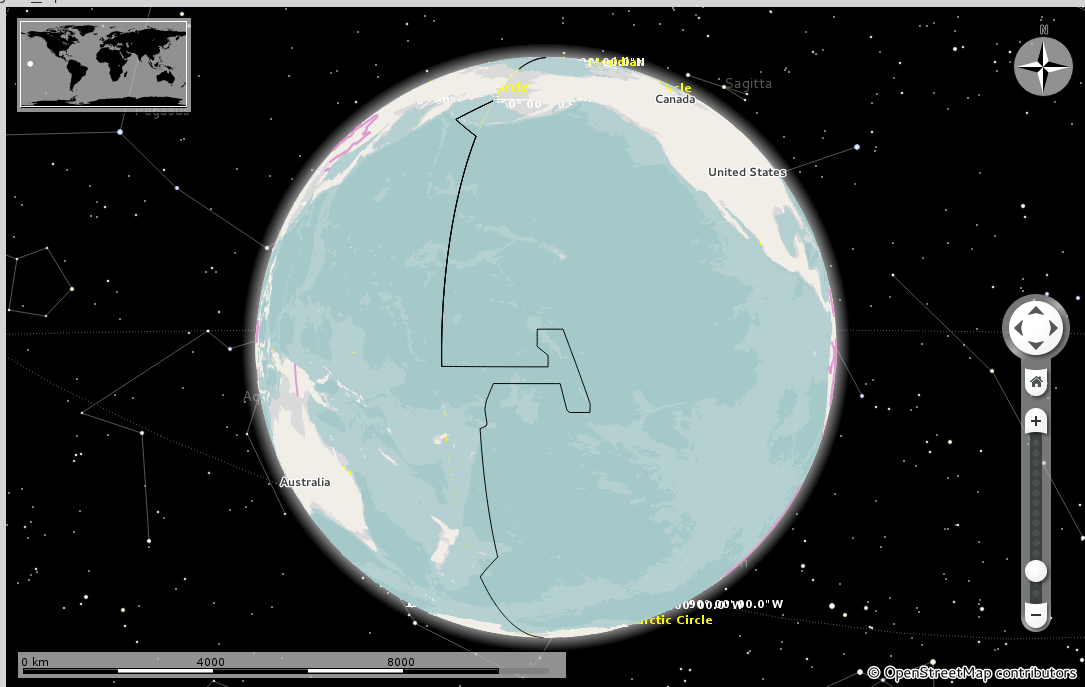
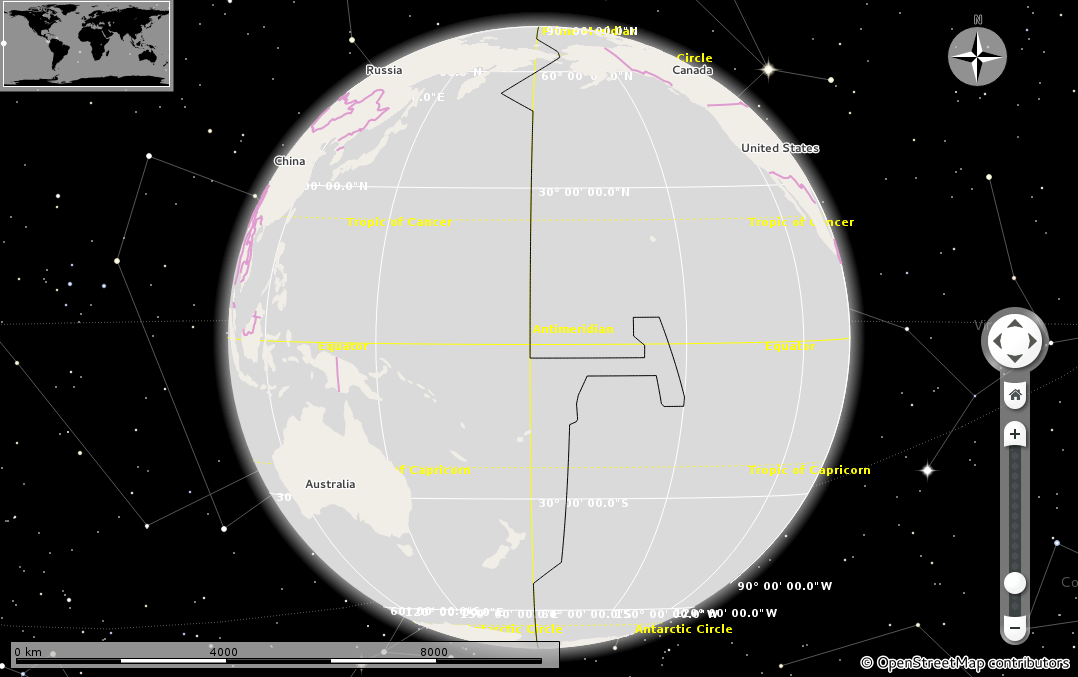
International Date Line
Created a custom OSM tag marble_line=date and tag mapped it to a new visual category InternationalDateLine.
Bathymetries
Styling Bathymetries was quite tricky since I was allowed to use only a single visual category for styling different kinds of bathymetries. Initially I thought that this was going to be straightforward and I only need to pass the elevation info of the bathymetry and depending on this info, I can then dynamically change the styling. However I eventually found that in order to do the above task, I need go down a layer of abstraction and hack a few things at the graphics level. The problem was that the bathymetries at level 200 and 4000 were getting mixed up. Ideally bathymetries at level 4000 should appear above the bathymetry at level 200 but since the z-value(which decides which feature must be rendered on top of others) is fixed for a particular GeoDataVisualCategory, rendering the bathymetries was getting messed up. I had to make special cases in the graphics related methods of Marble so as to circumvent this problem.